
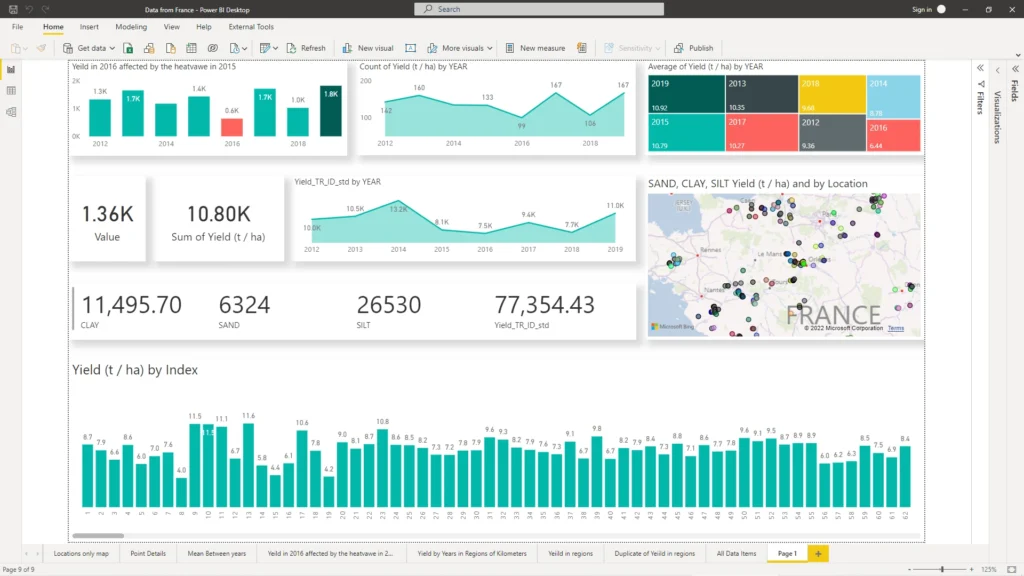
Data dashboard · Power BI
Power BI Data Analysis Report – Bringing Insightful Information From the Raw Data of the Land of France
Comparative Power BI dashboards for reading two markets side by side without manual spreadsheet work.
Client
Germany & France analysis engagement
Sector
Market intelligence
Data & Business Intelligence
Power BI
Excel
Tableau
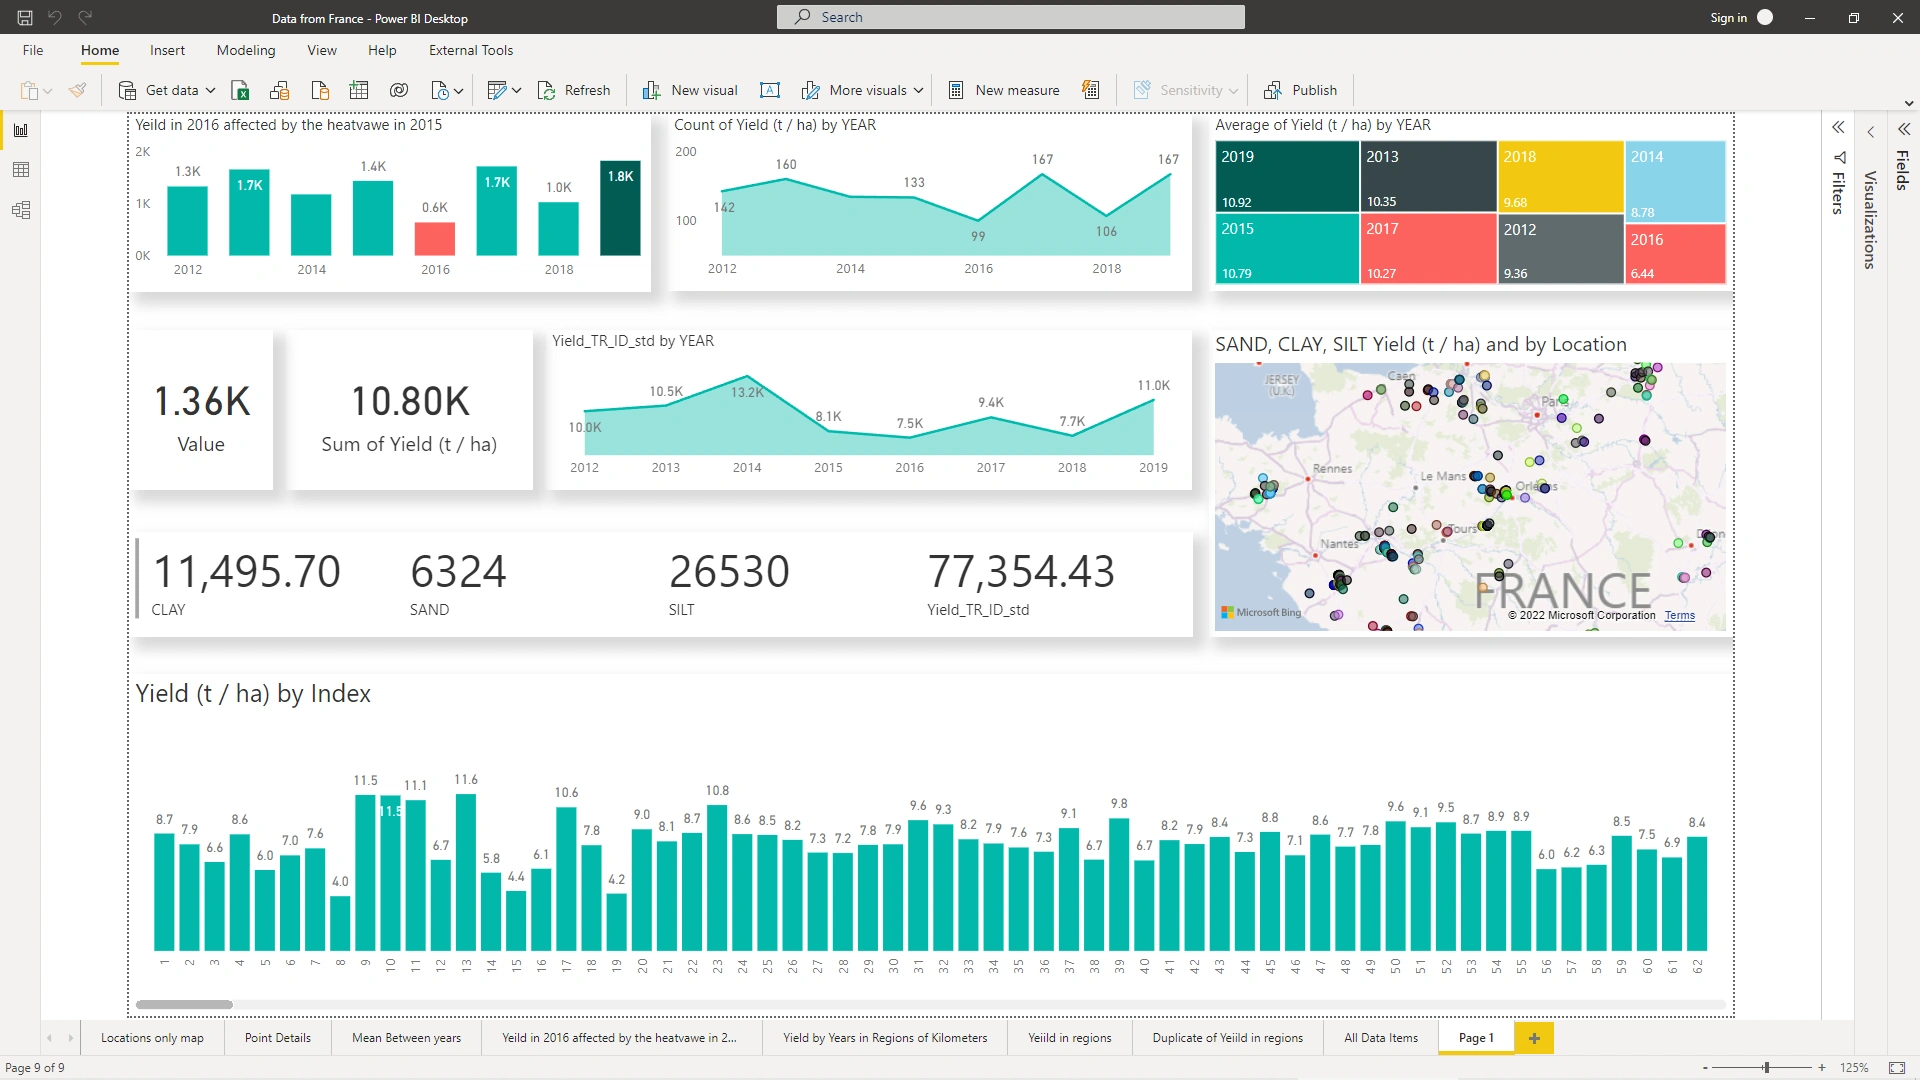
Side-by-side market comparison dashboard
Shared filters and consistent measures across markets
Challenge
Comparing two markets side by side without manual spreadsheet work.
What we built
Key decisions.
Comparative dashboards designed for Germany and France in one place.
Shared filters so both markets respond to the same period and dimension cuts.
Consistent measures so totals and rates mean the same thing on either side.
Views organised for counts, groups, trends and time-series analysis.
Result
What changed.
Counts, groups, trends and time-series analysis are available in one comparative view — so market differences are easier to spot and explain.
Previous
Next
Start a conversation