
Case study
Oil Market Analysis – From Raw Data in Excel to Story-Telling Dashboard of Microsoft Power BI
A Power BI dashboard that brings oil market data into one clear view for comparison over time and region.
Data & Business Intelligence
Power BI
Excel
Tableau
Client
Oil market analysis engagement
Sector
Energy · Market intelligence
Services
Data & Business Intelligence
Tools
Power BI · Excel · Tableau
Challenge
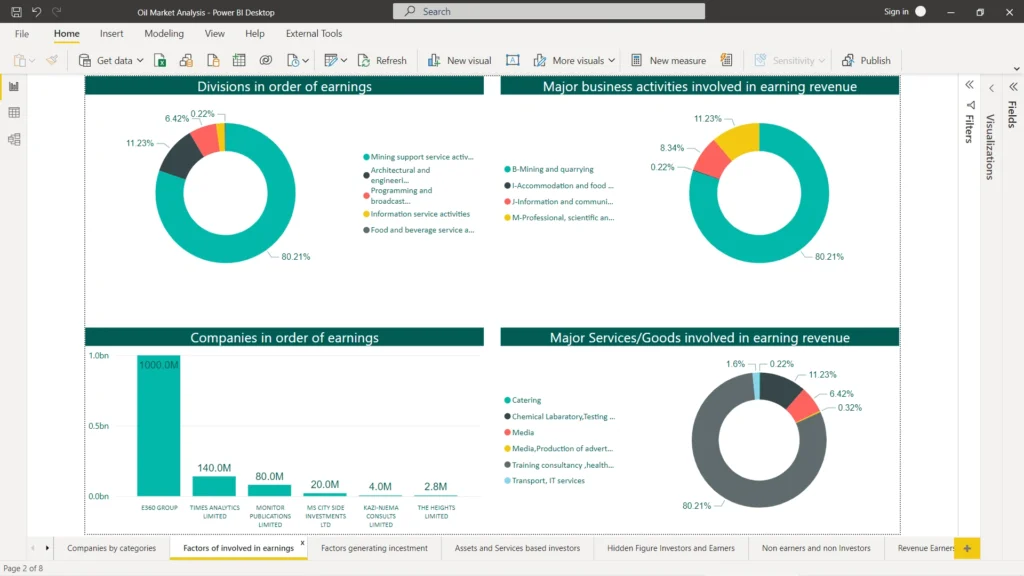
Market data sat in separate tables and was hard to compare over time or region, in an Excel file.
What we built
Key decisions.
One modelled dataset combining the source tables into a reliable structure for analysis.
Interactive filters for period, region and product so stakeholders can cut the data their way.
KPI cards for the measures that matter most at a glance.
Trend views that make performance over time easier to read than spreadsheet rows.
Result
What changed.
More than 10 sources in one view — so comparisons no longer depend on manual spreadsheet work.
10+
Data sources unified in one dashboard
Gallery
Selected views.
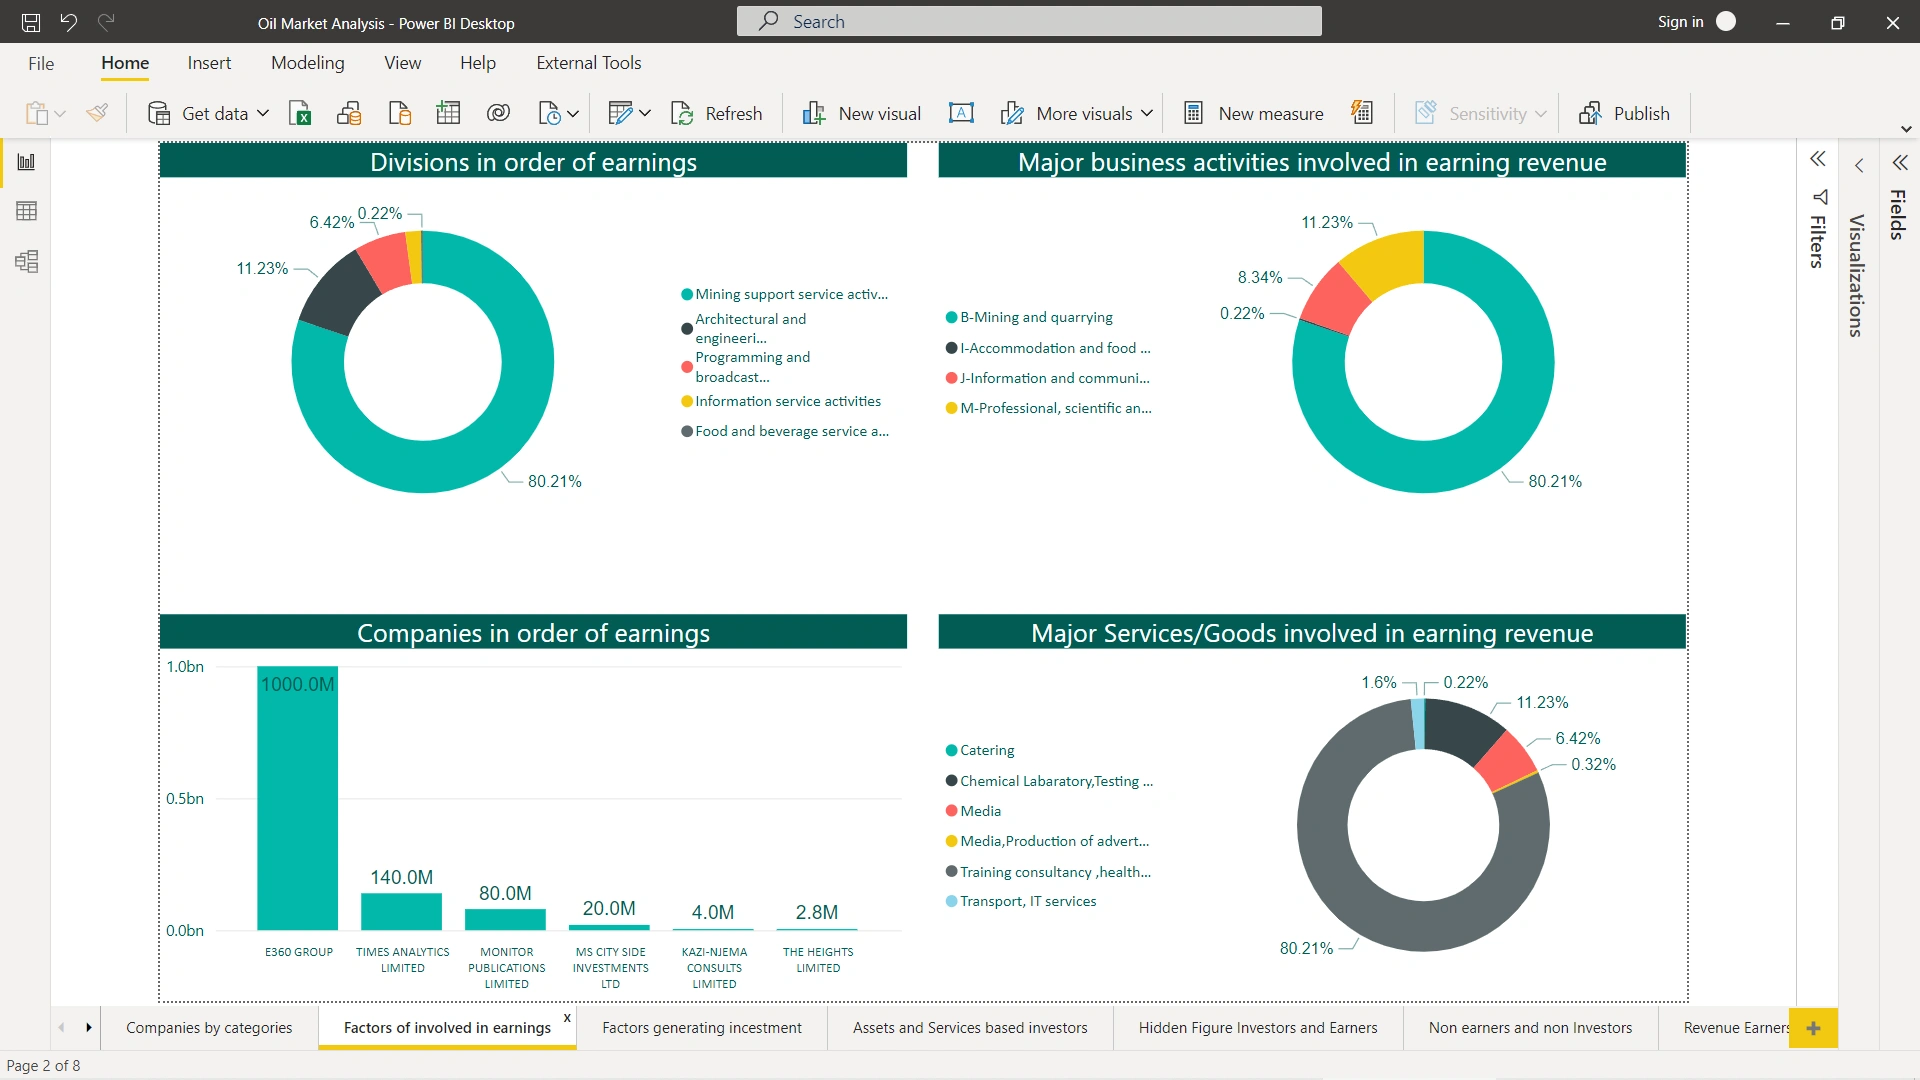
Dashboard overview with KPI cards and trend views
Interactive filters for period, region and product
Previous
Next
Start a conversation