by teamwhitehatcooperatives | Oct 24, 2026
Software for a medical store — built in MS Access with Power BI analytics and ongoing after-sales support.
Data & Business Intelligence
Healthcare · Retail pharmacy
Business Applications · Data & Business Intelligence
MS Access · Power BI · Excel · SQL · Tableau
Running a medical store needs reliable day-to-day software — stock, sales and records — plus support that continues after launch.
MS Access application tailored to medical store operations.
Workflows for the routines the pharmacy relies on every day.
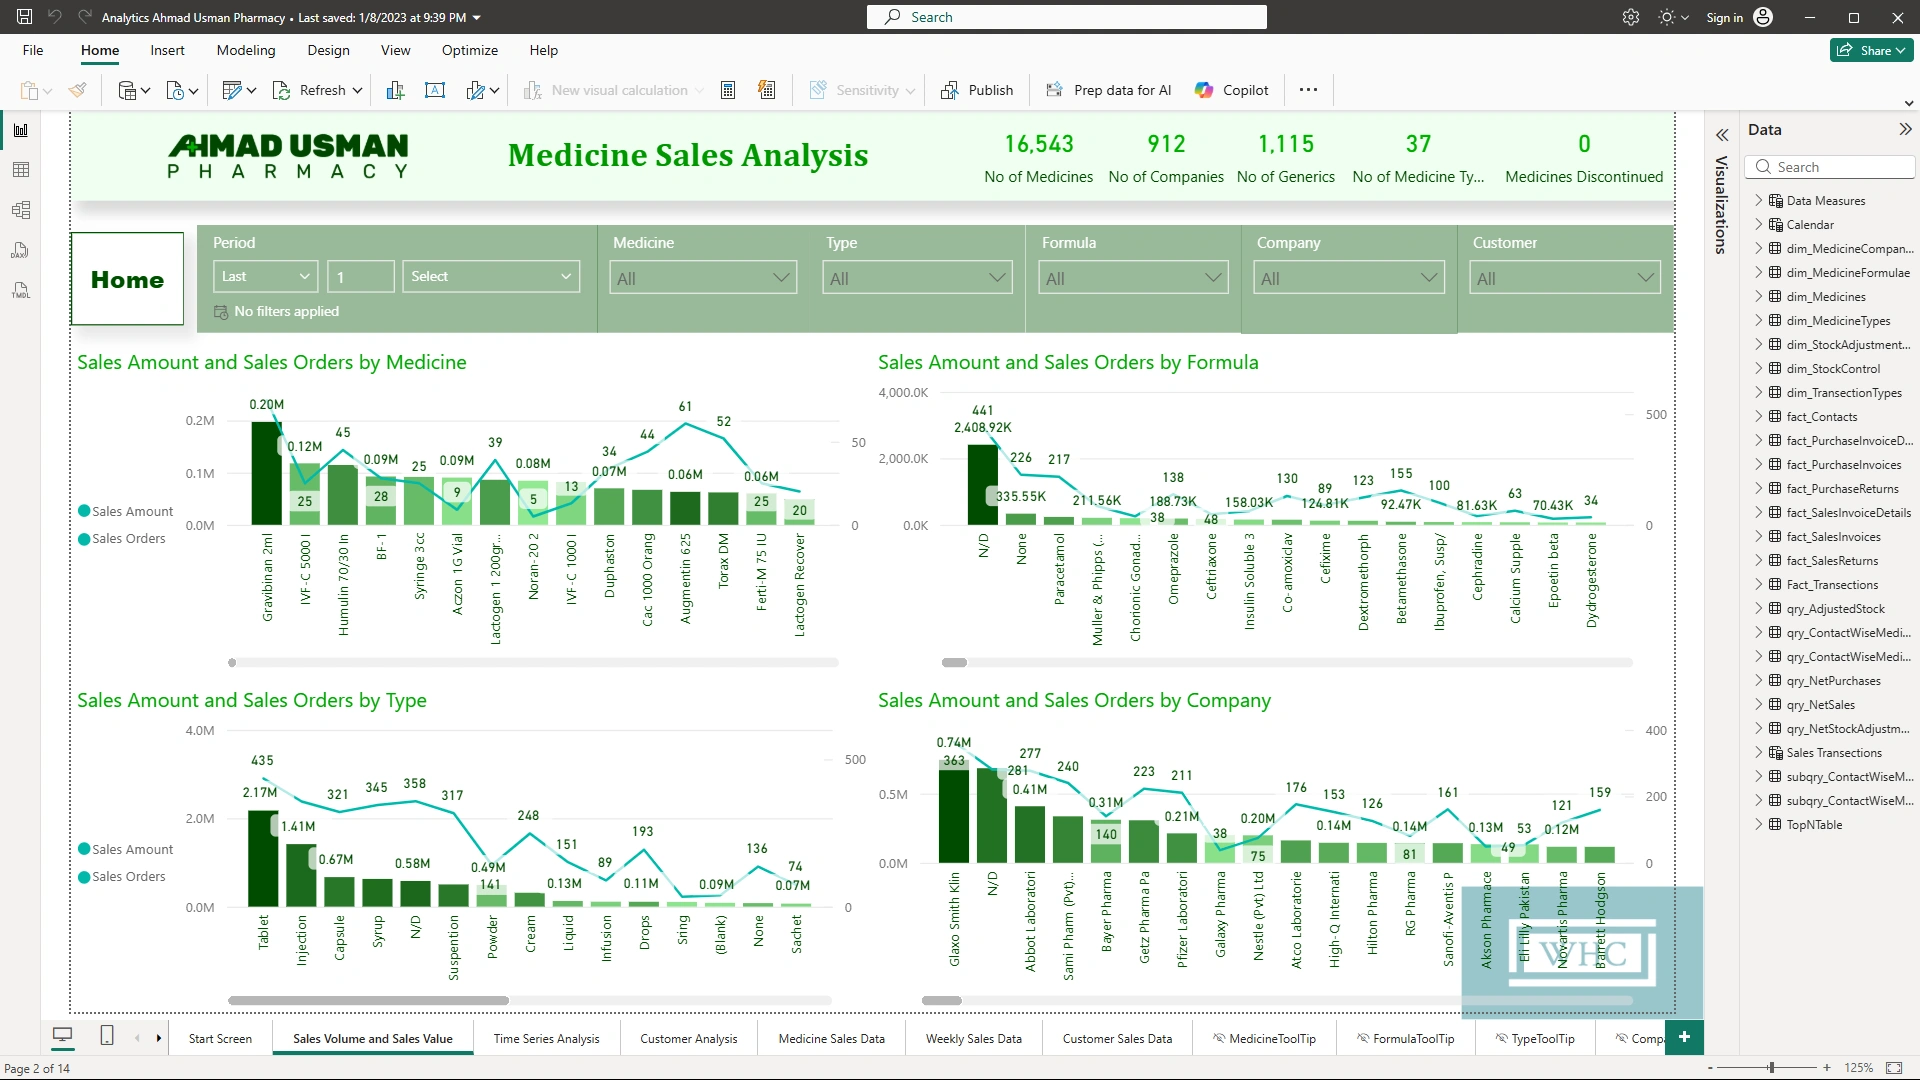
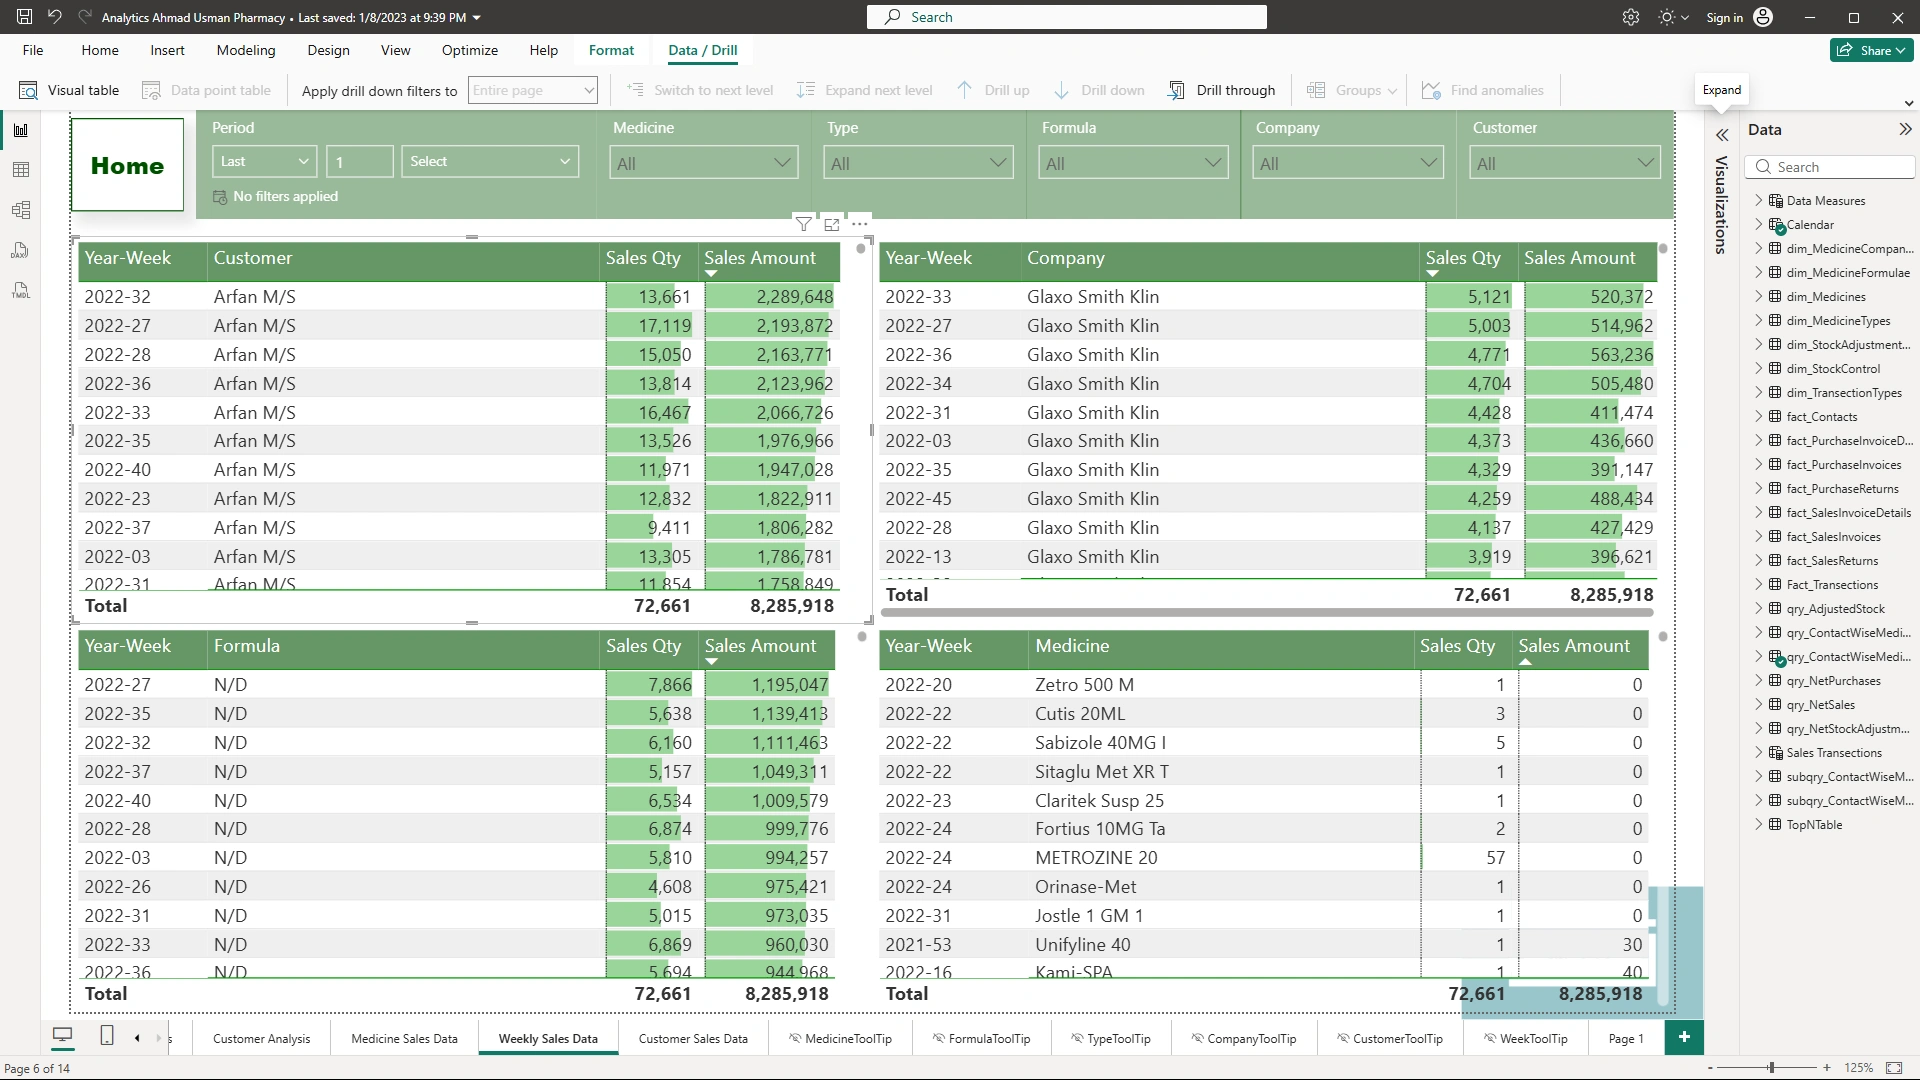
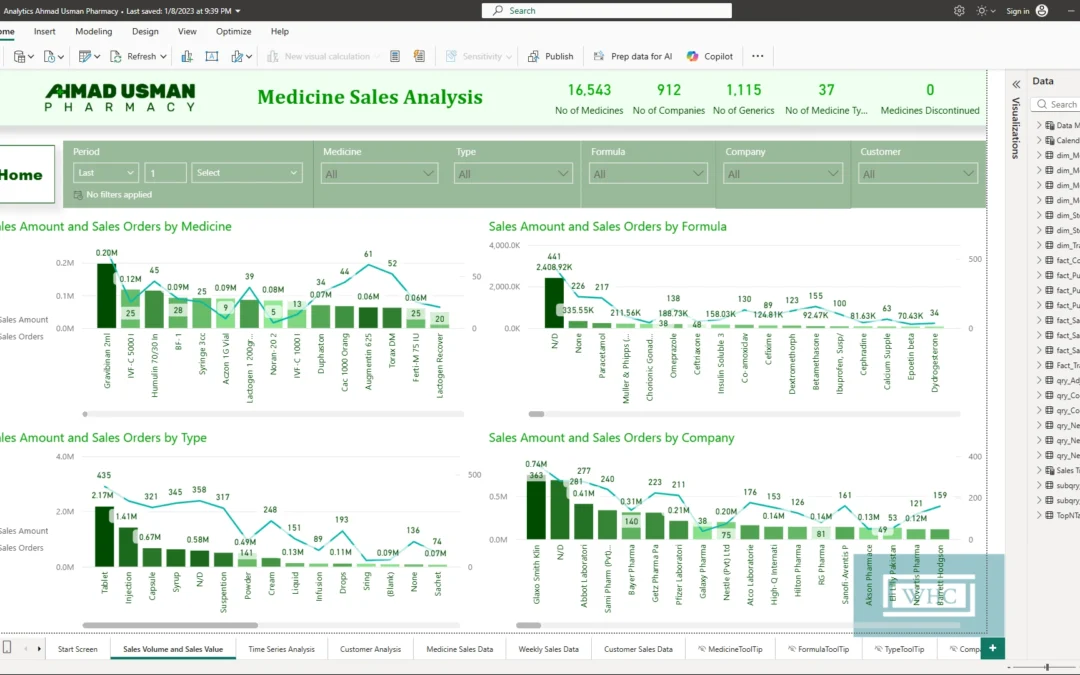
Power BI analytics for clearer reporting on top of the operational data.
Ongoing after-sales support so the system keeps matching how the store works.
Software for a medical store with ongoing after-sales support — serving the pharmacy's needs more than expected, in the client's words, with support that lives up to "Cooperatives" in the name.
"We have been using the software from White-Hat Cooperatives for our medical store and it has served all our needs more than we expected. Their after sales services are also very good and they mean to the word of Cooperatives in their name."
Usman Ahmad · Owner · Ahmad Usman Pharmacy
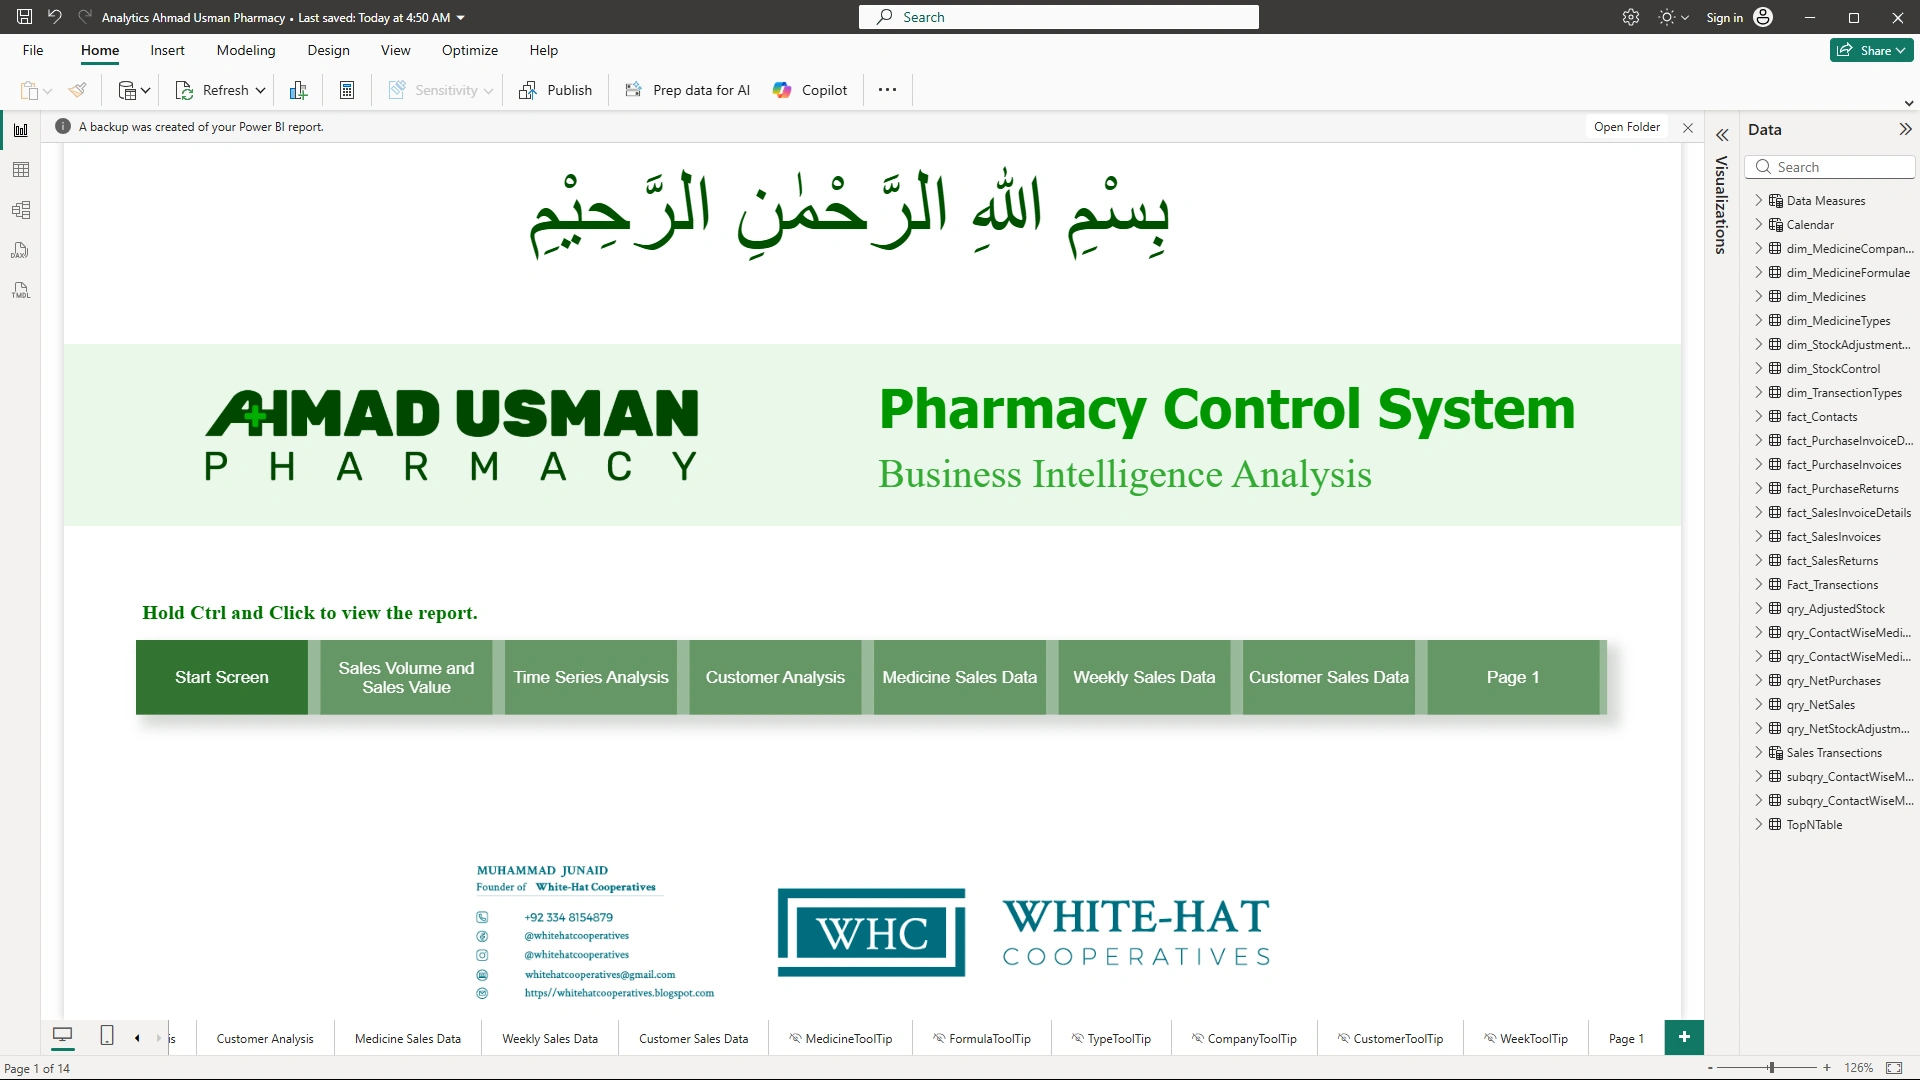
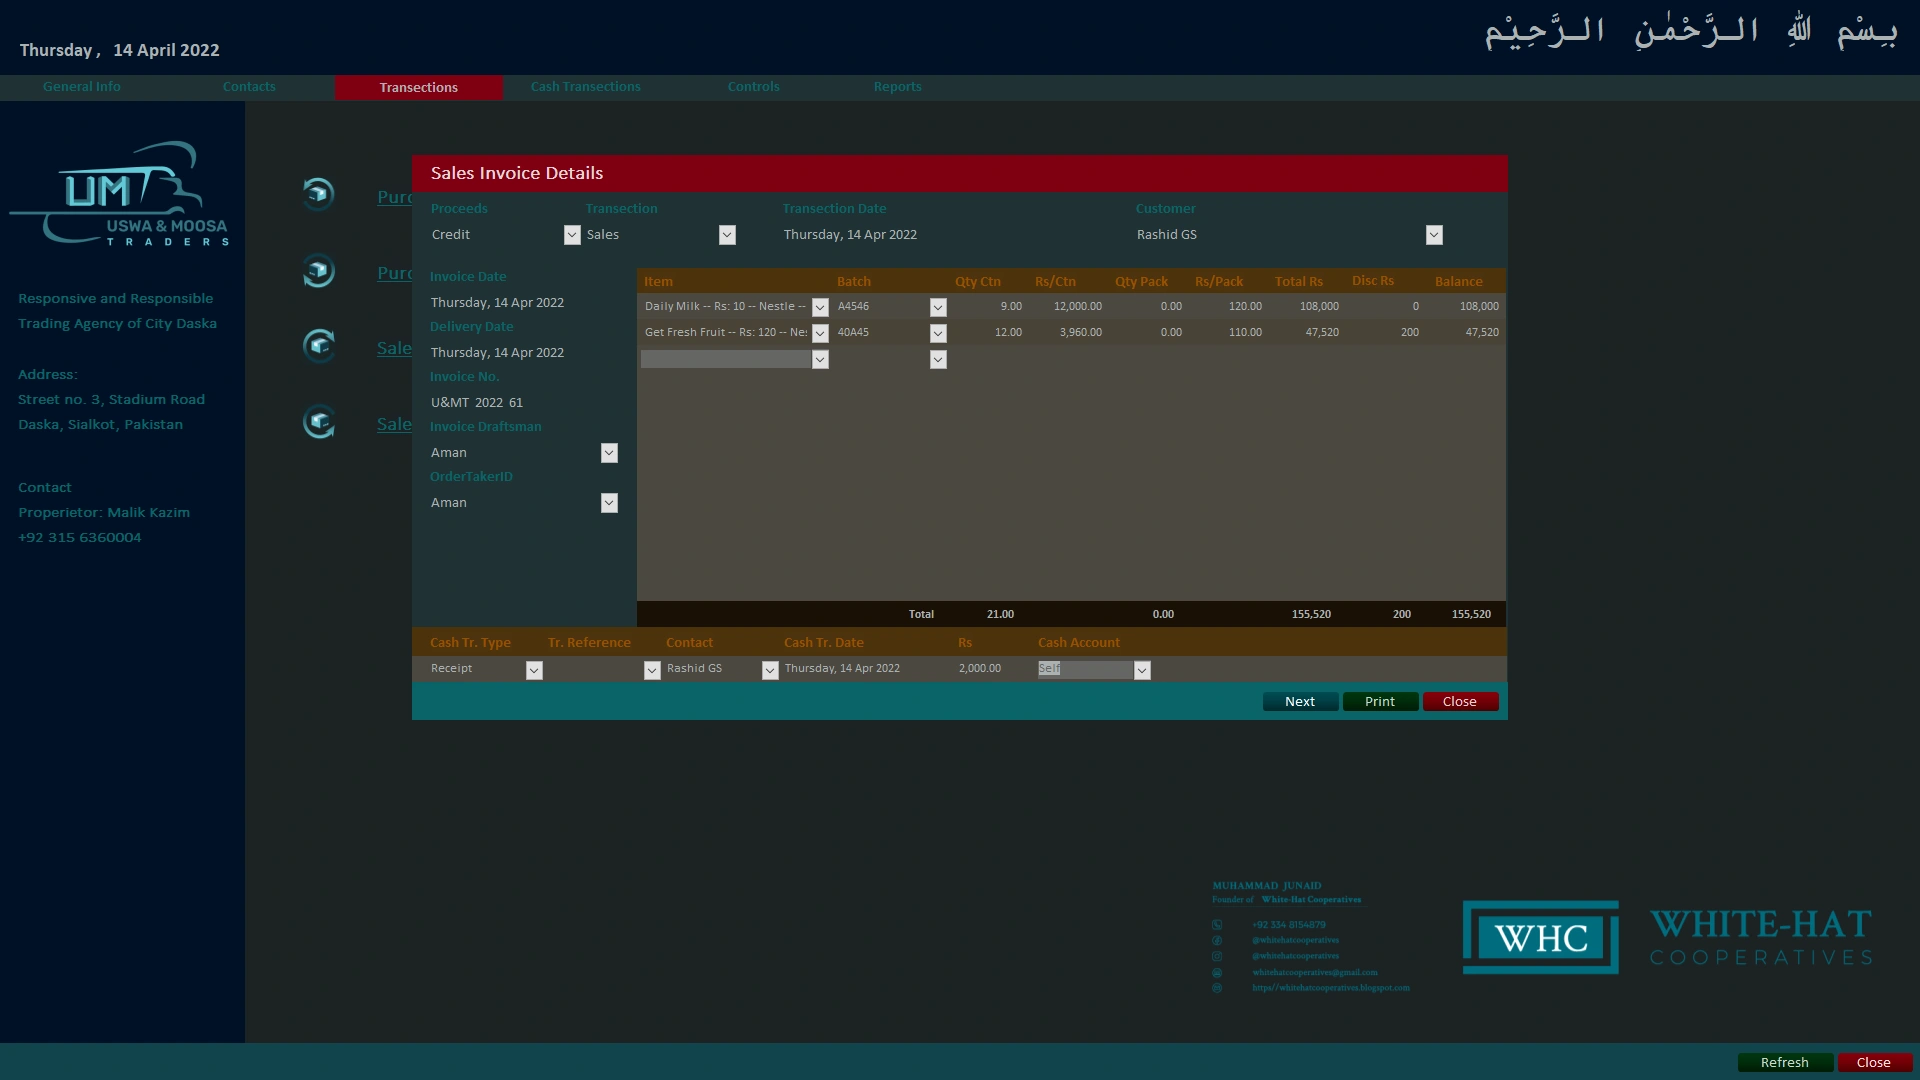
Pharmacy software overview
Day-to-day store workflows
Records and reporting views
by teamwhitehatcooperatives | Oct 24, 2026
MS Access trading software with Power BI analytics — purchases, sales, returns and the reports needed to run the business.
Data & Business Intelligence
Business Applications · Data & Business Intelligence
MS Access · Power BI · Excel · SQL · Tableau
Managing trading operations and getting reliable reports.
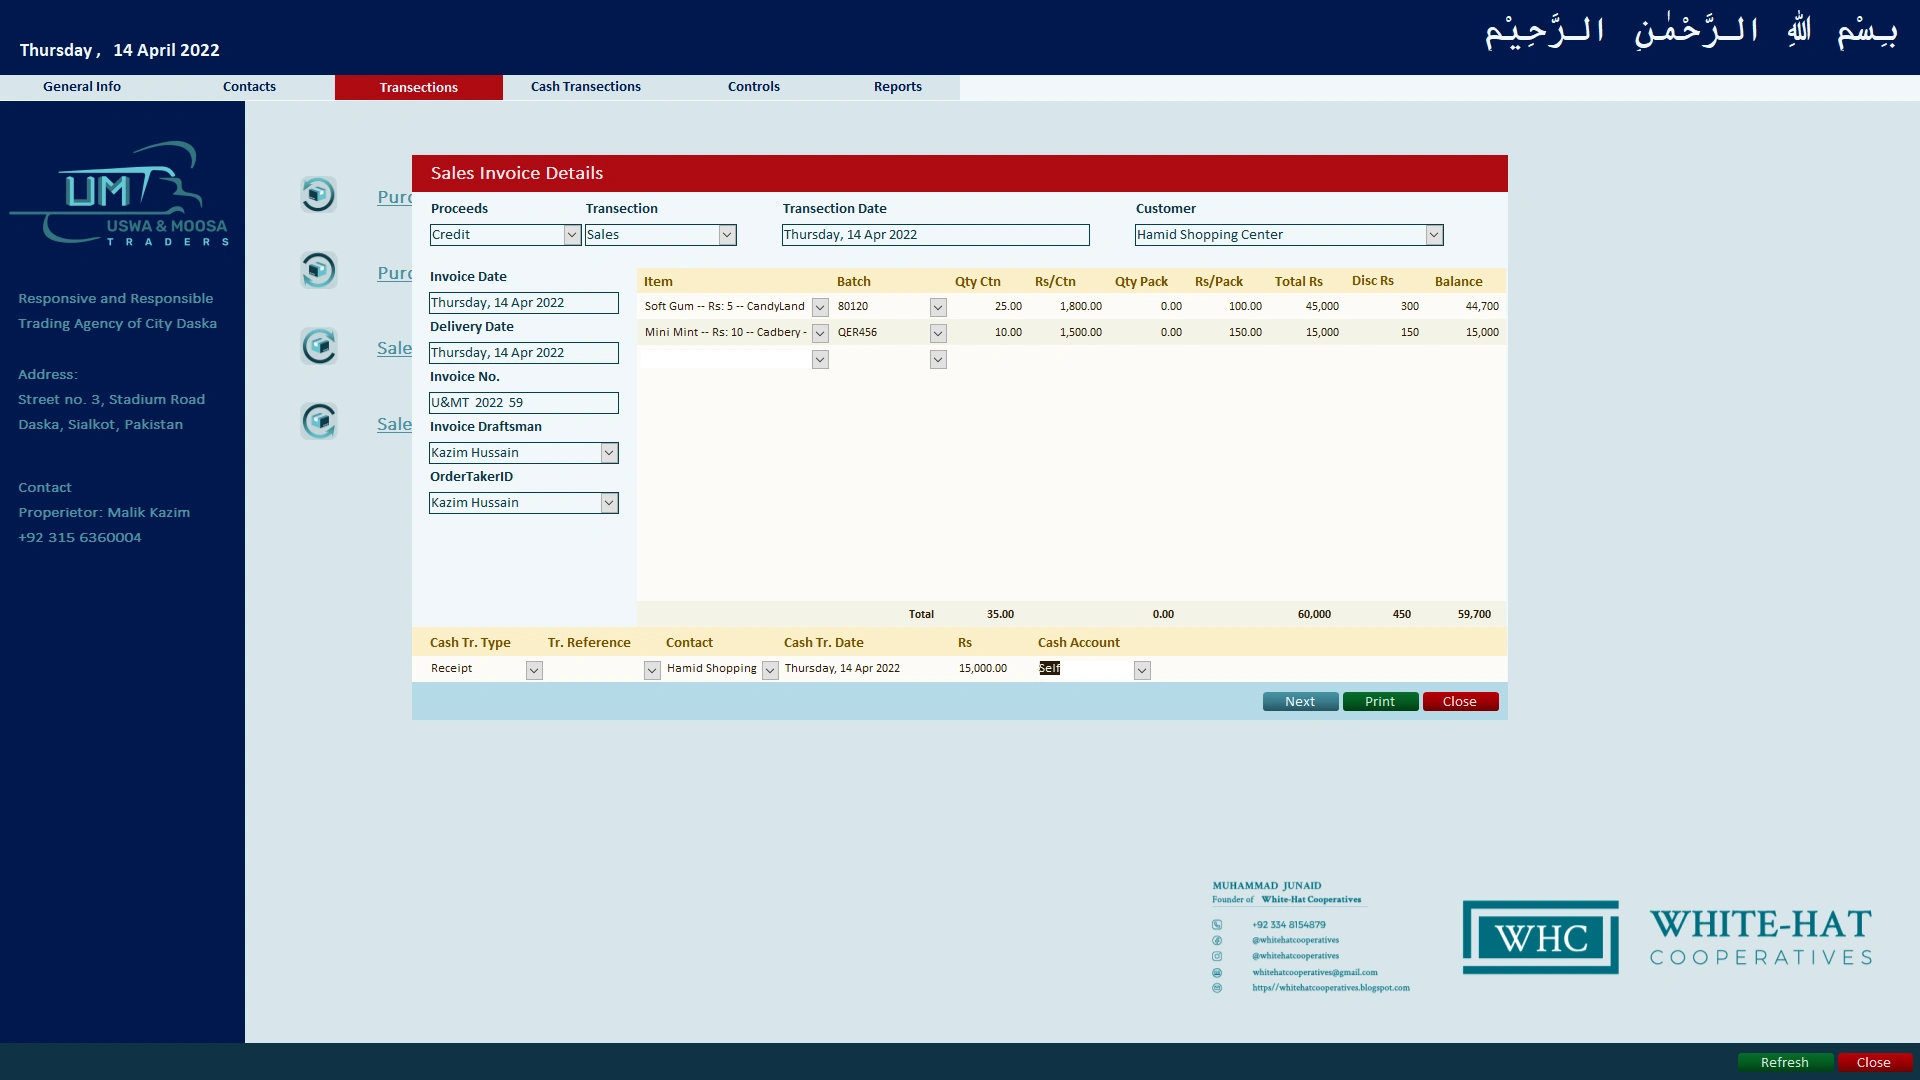
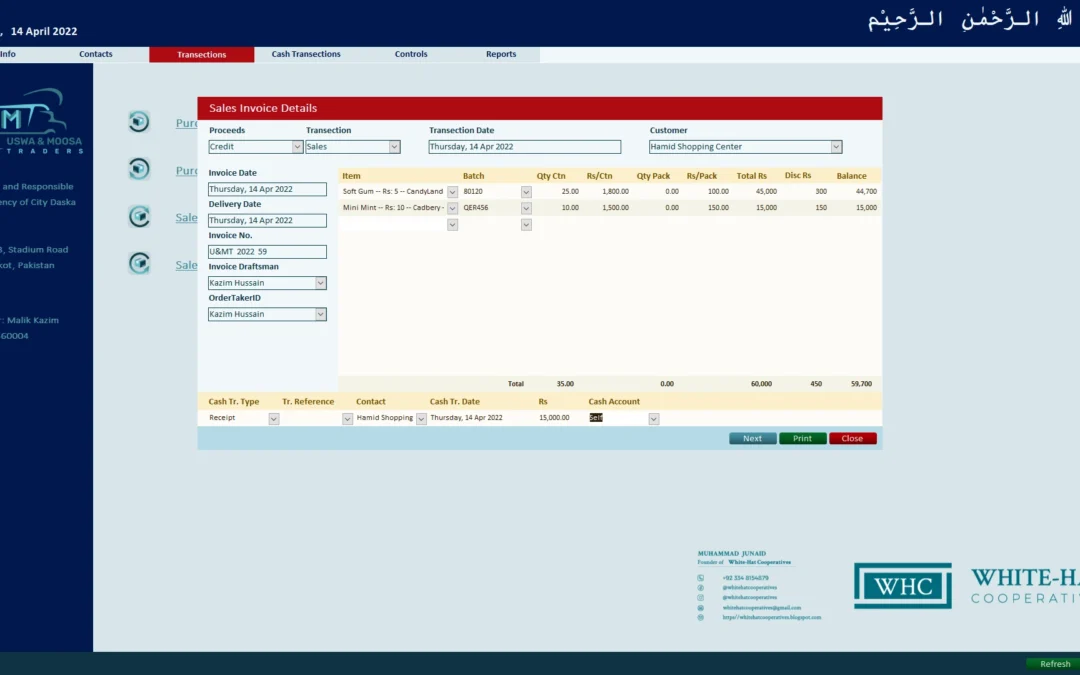
Purchases module for recording and tracking inbound stock.
Sales and returns workflows that keep day-to-day trading organised.
Operational reports inside the application for routine management.
Power BI analytics layered on the data for deeper performance views.
The reports needed to manage and grow — in the client's words, software that supports operations and business growth.
"Their software for our trading business is very good and provides us with all the reports we need to manage our operations and grow our business."
Uswa & Moosa Traders · Trading business software
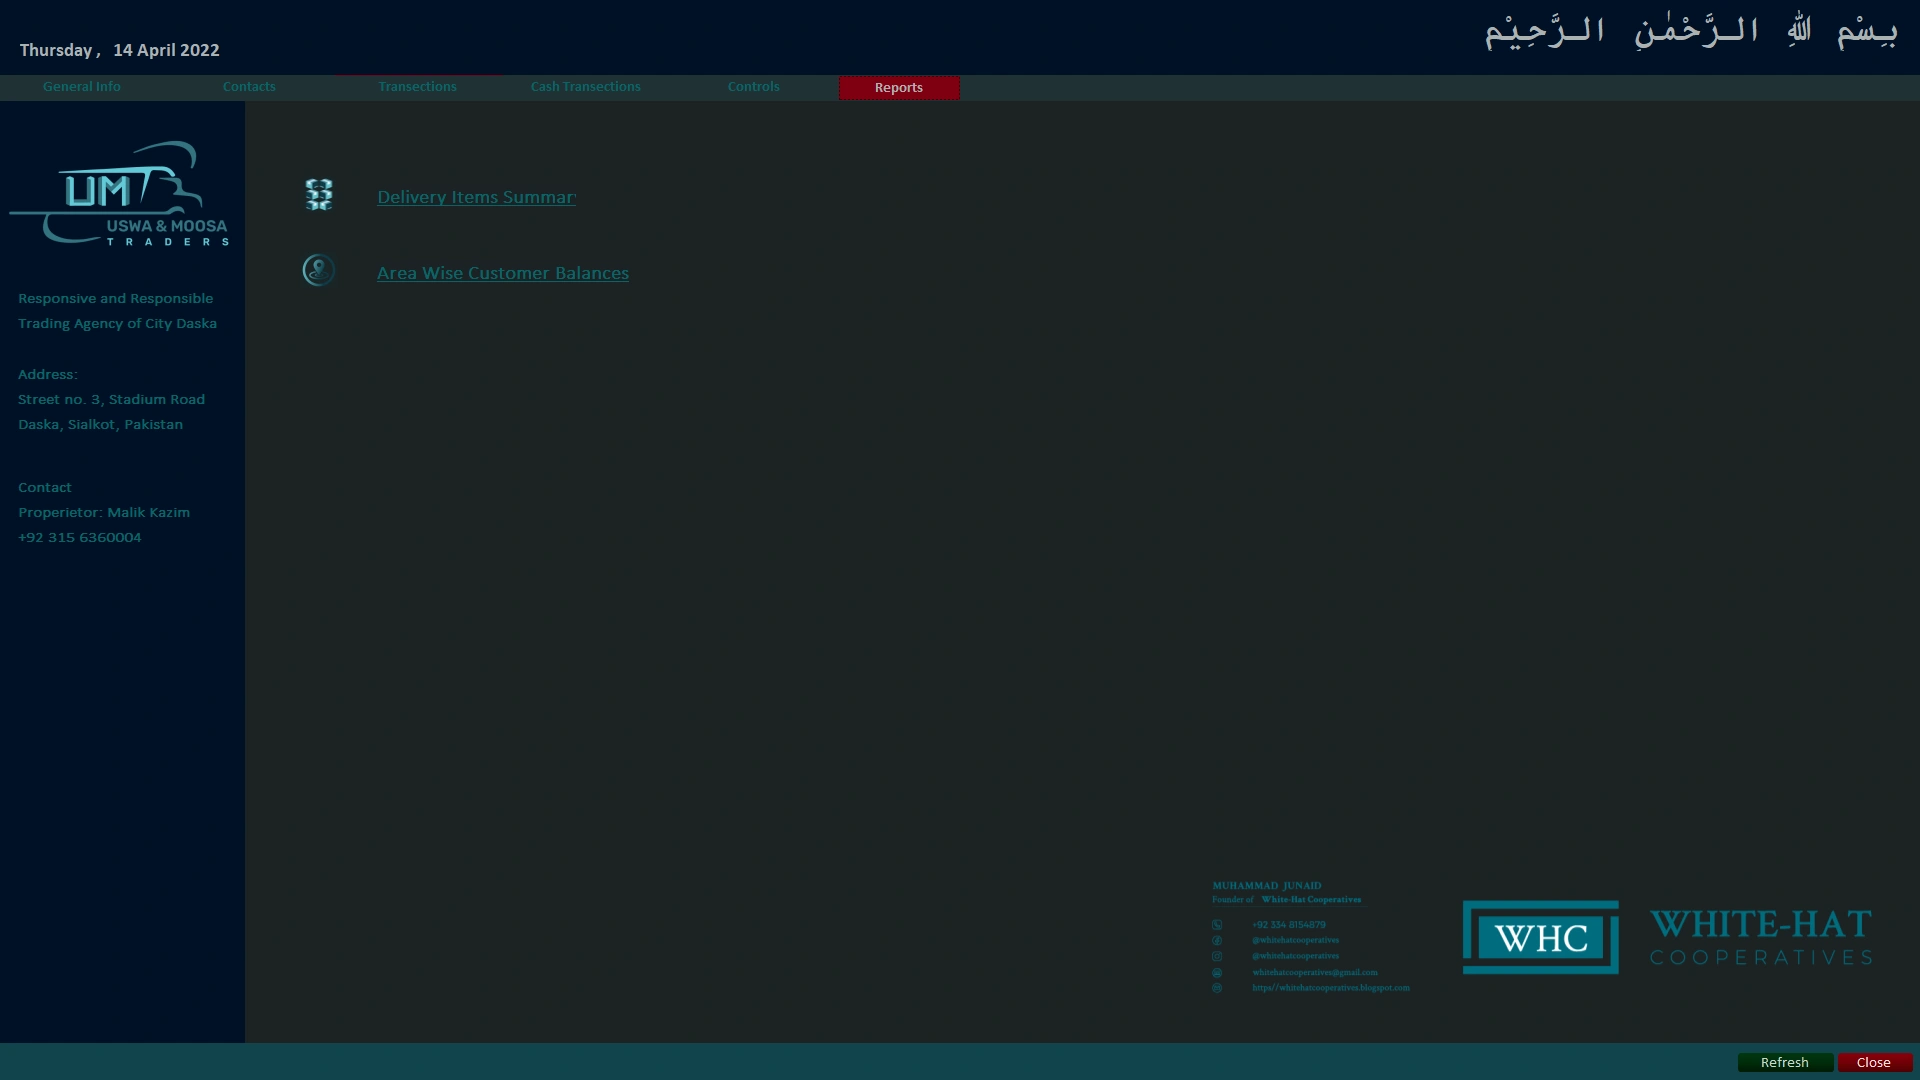
Trading application overview
Purchases, sales and returns workflows
by teamwhitehatcooperatives | Oct 24, 2026
Data dashboard · Power BI
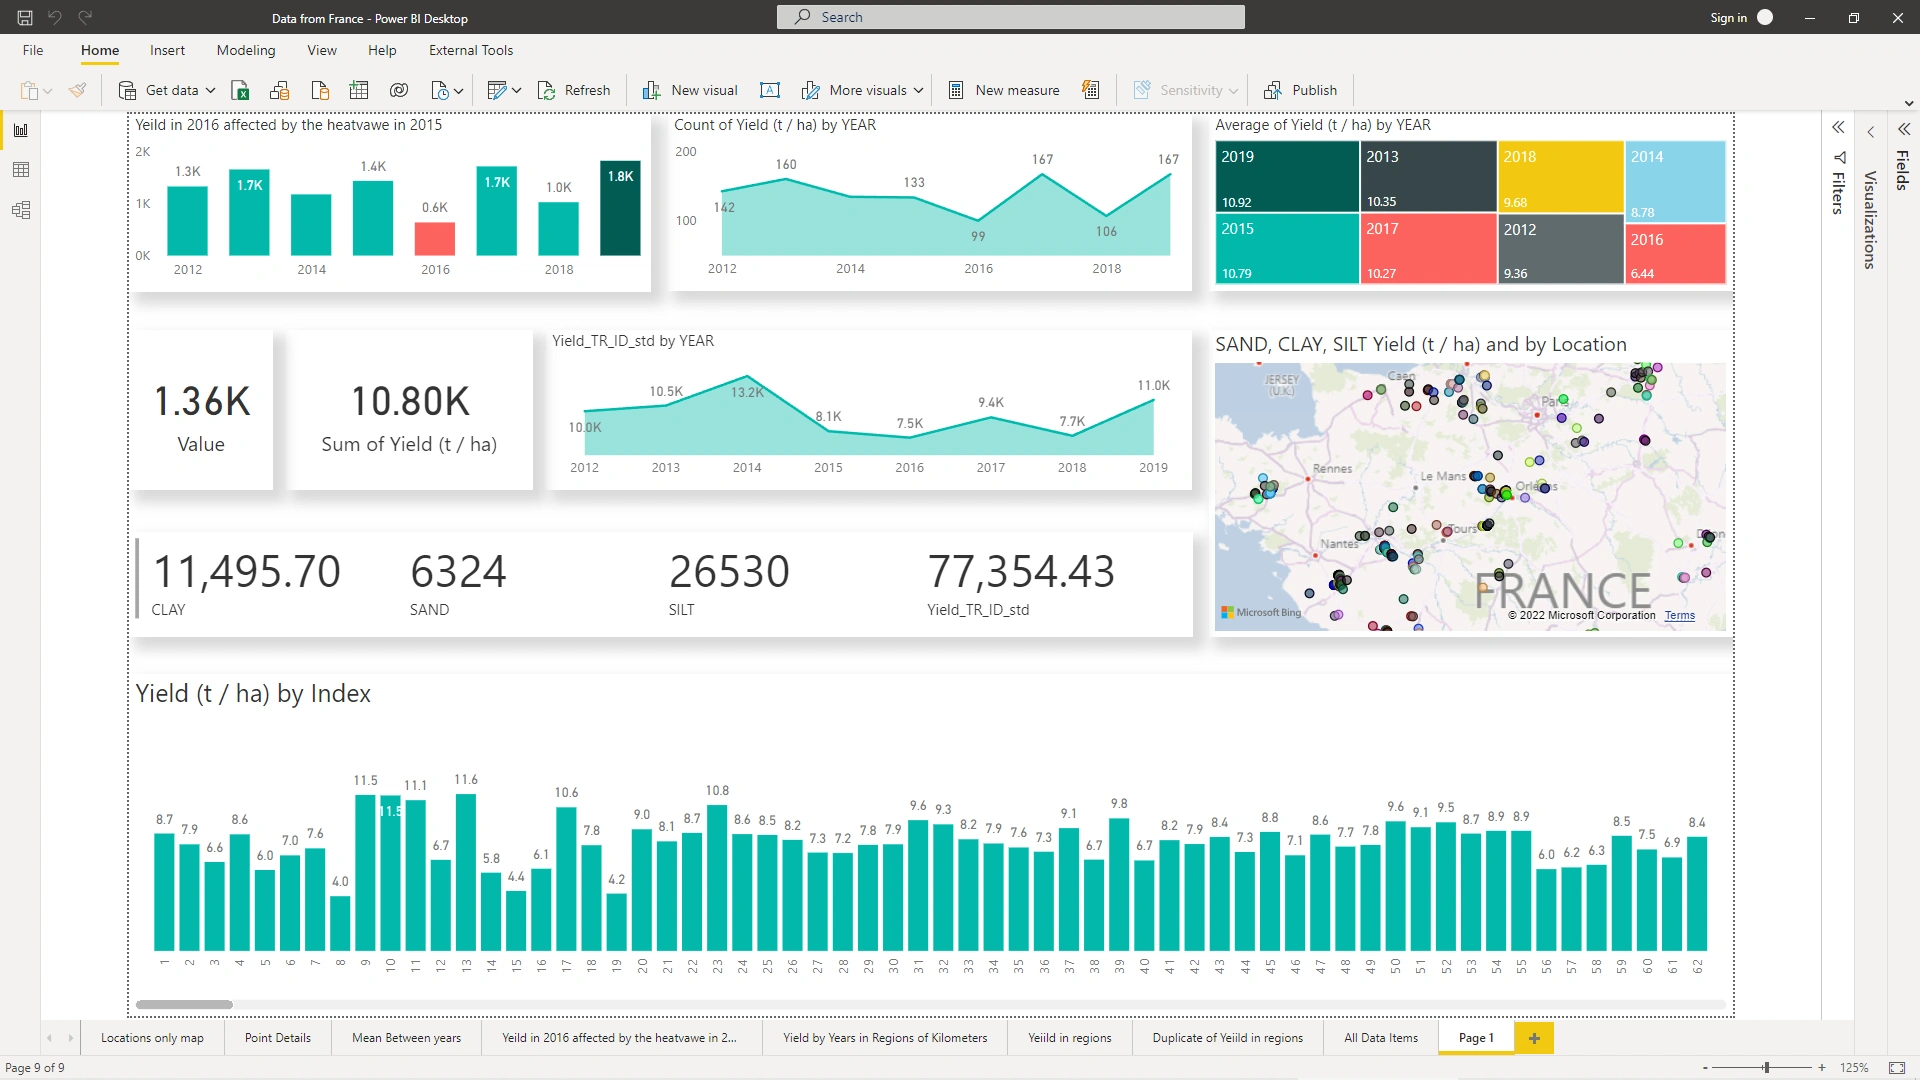
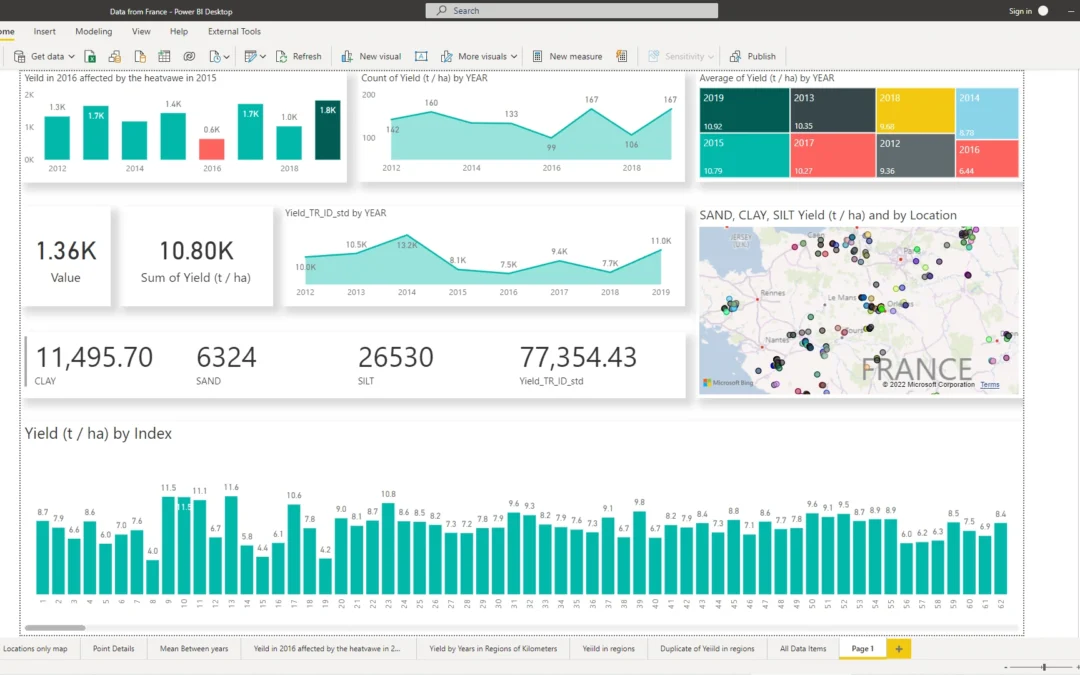
Comparative Power BI dashboards for reading two markets side by side without manual spreadsheet work.
Germany & France analysis engagement
Data & Business Intelligence
Side-by-side market comparison dashboard
Shared filters and consistent measures across markets
Comparing two markets side by side without manual spreadsheet work.
Comparative dashboards designed for Germany and France in one place.
Shared filters so both markets respond to the same period and dimension cuts.
Consistent measures so totals and rates mean the same thing on either side.
Views organised for counts, groups, trends and time-series analysis.
Counts, groups, trends and time-series analysis are available in one comparative view — so market differences are easier to spot and explain.
by teamwhitehatcooperatives | Oct 24, 2026
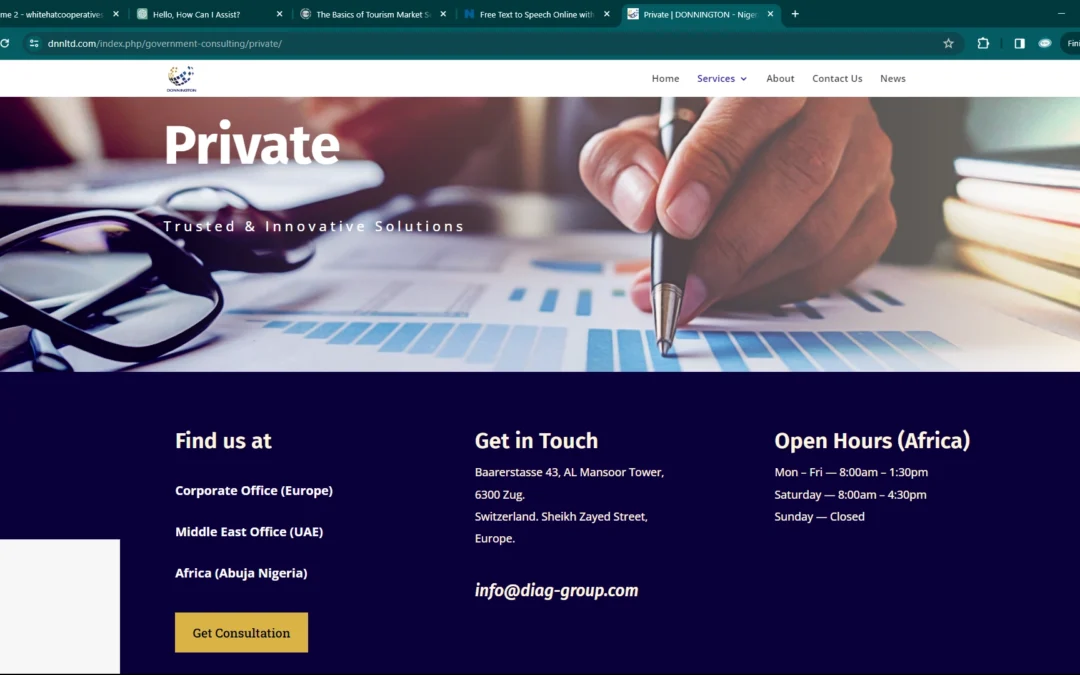
A clear, credible WordPress website built with Divi to present the business with professionalism.
WordPress · Divi · HTML & CSS · JavaScript · PHP
Needed a clear, credible online presence.
Custom design aligned with how DNN Ltd wants to be seen online.
Responsive WordPress build using the Divi theme for flexible page layouts.
Structured service pages so visitors can find what the business offers quickly.
Straightforward communication throughout delivery so content and design stayed aligned.
The site has been online since 2022, giving DNN Ltd a professional home on the web that feels true to the business.
"White-Hat Cooperatives understood what we needed and turned it into a website that feels clear, professional, and true to our business. Communication was straightforward throughout."
Billy Gambari · Founder · DNN Ltd
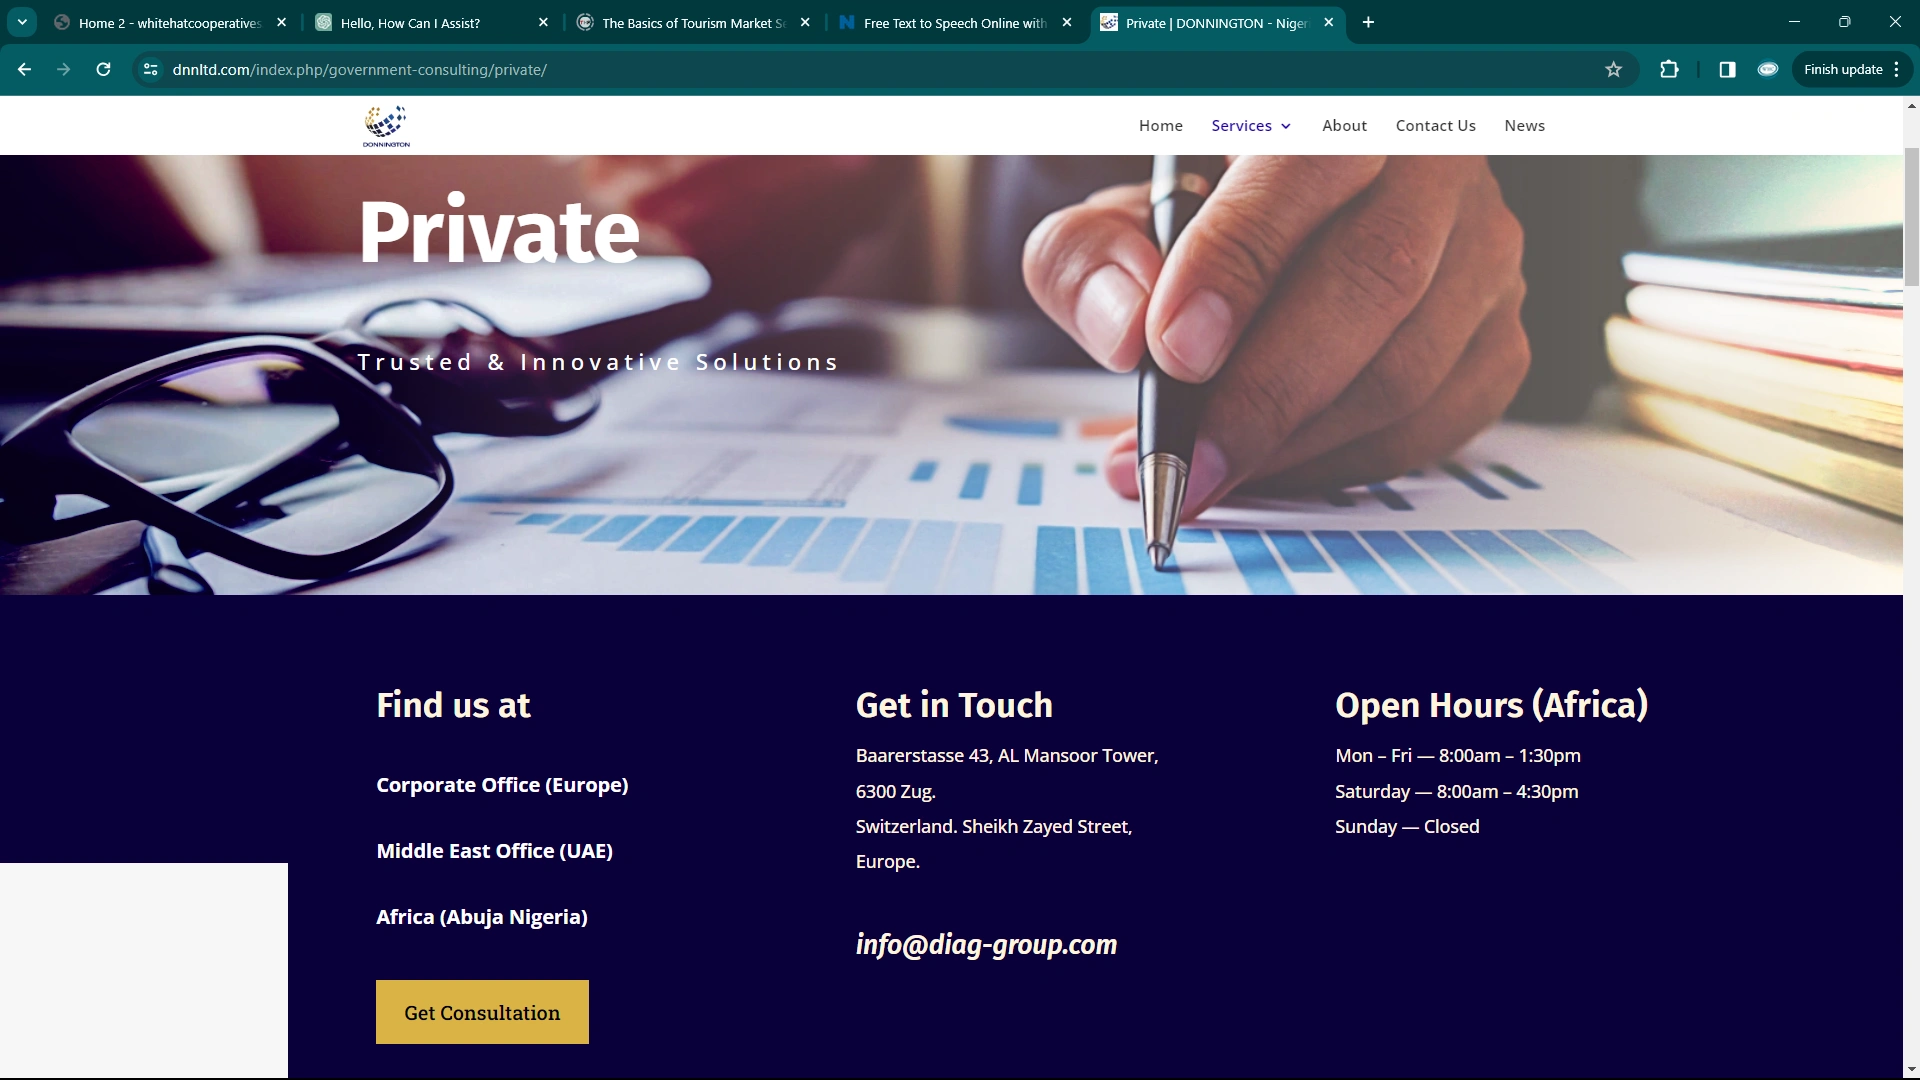
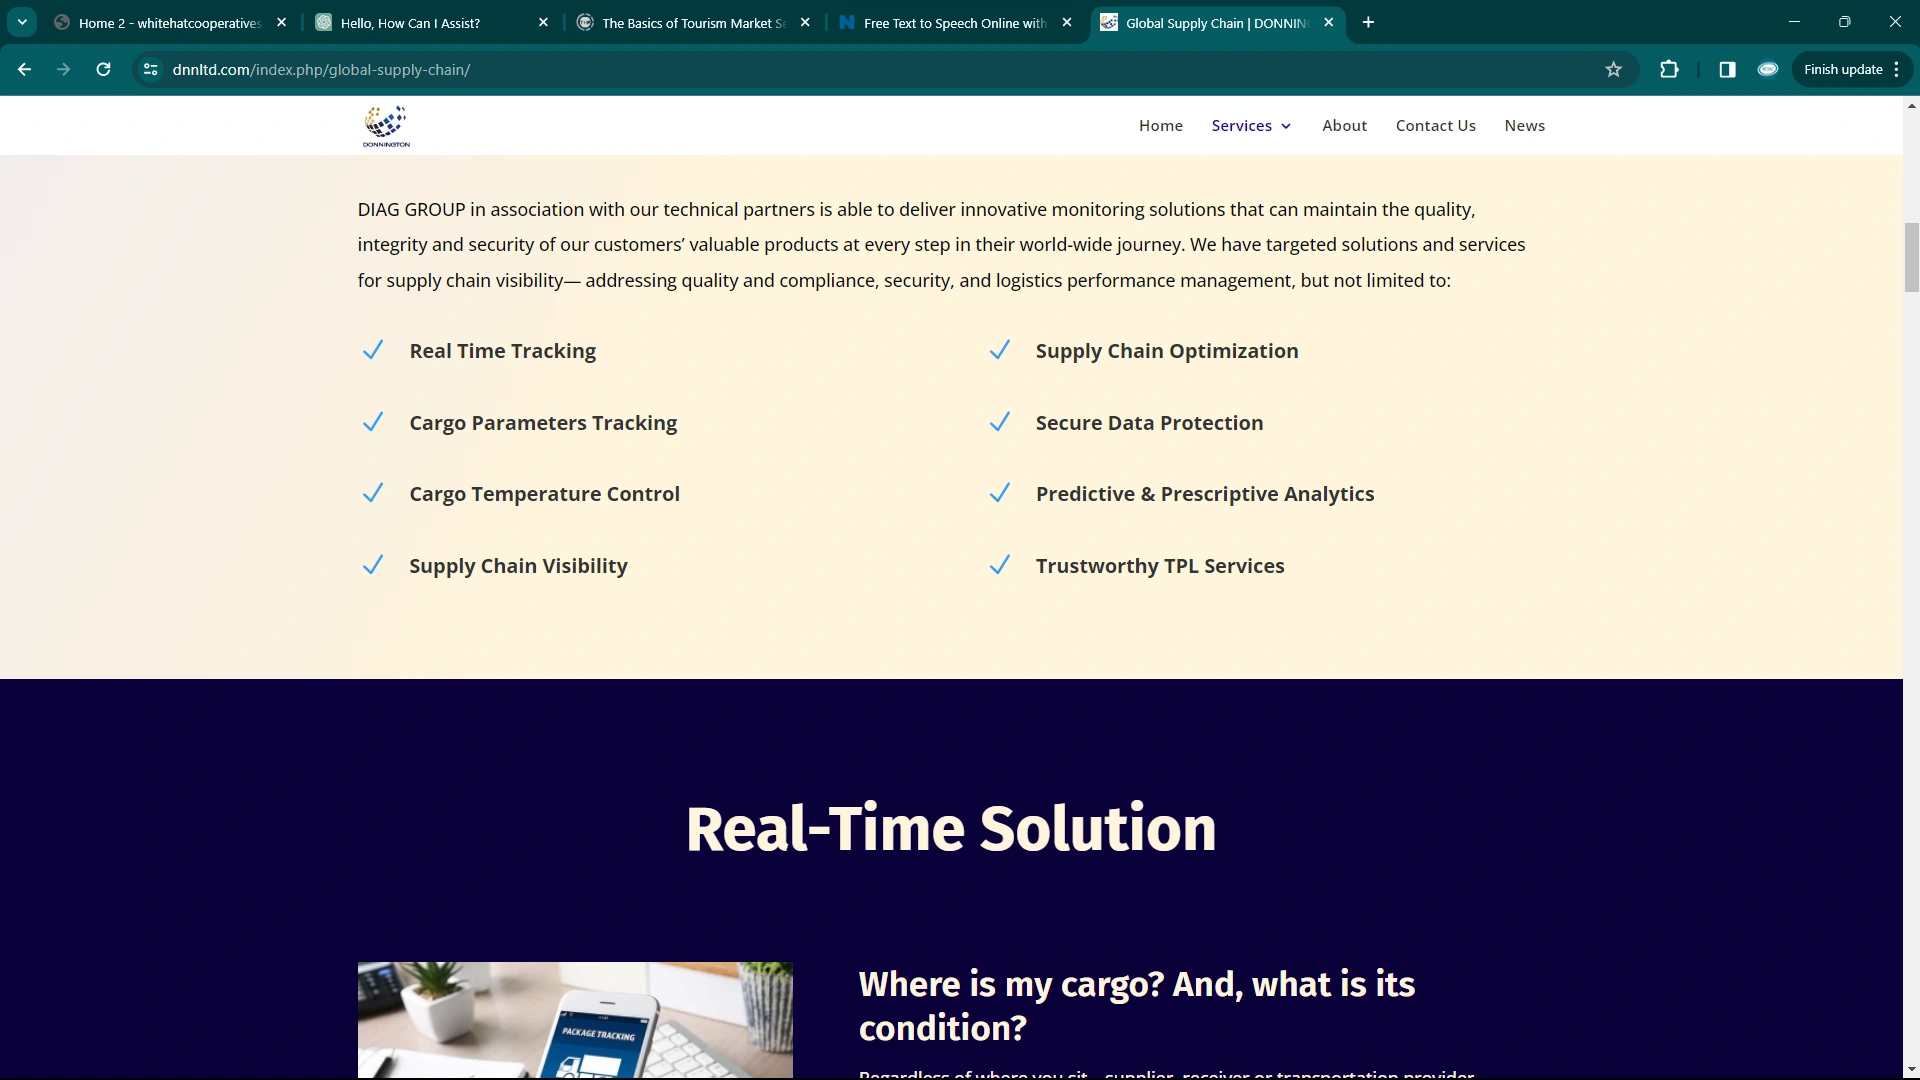
Homepage — clear, credible first impression
Brand mark used across the site
by teamwhitehatcooperatives | Oct 24, 2026
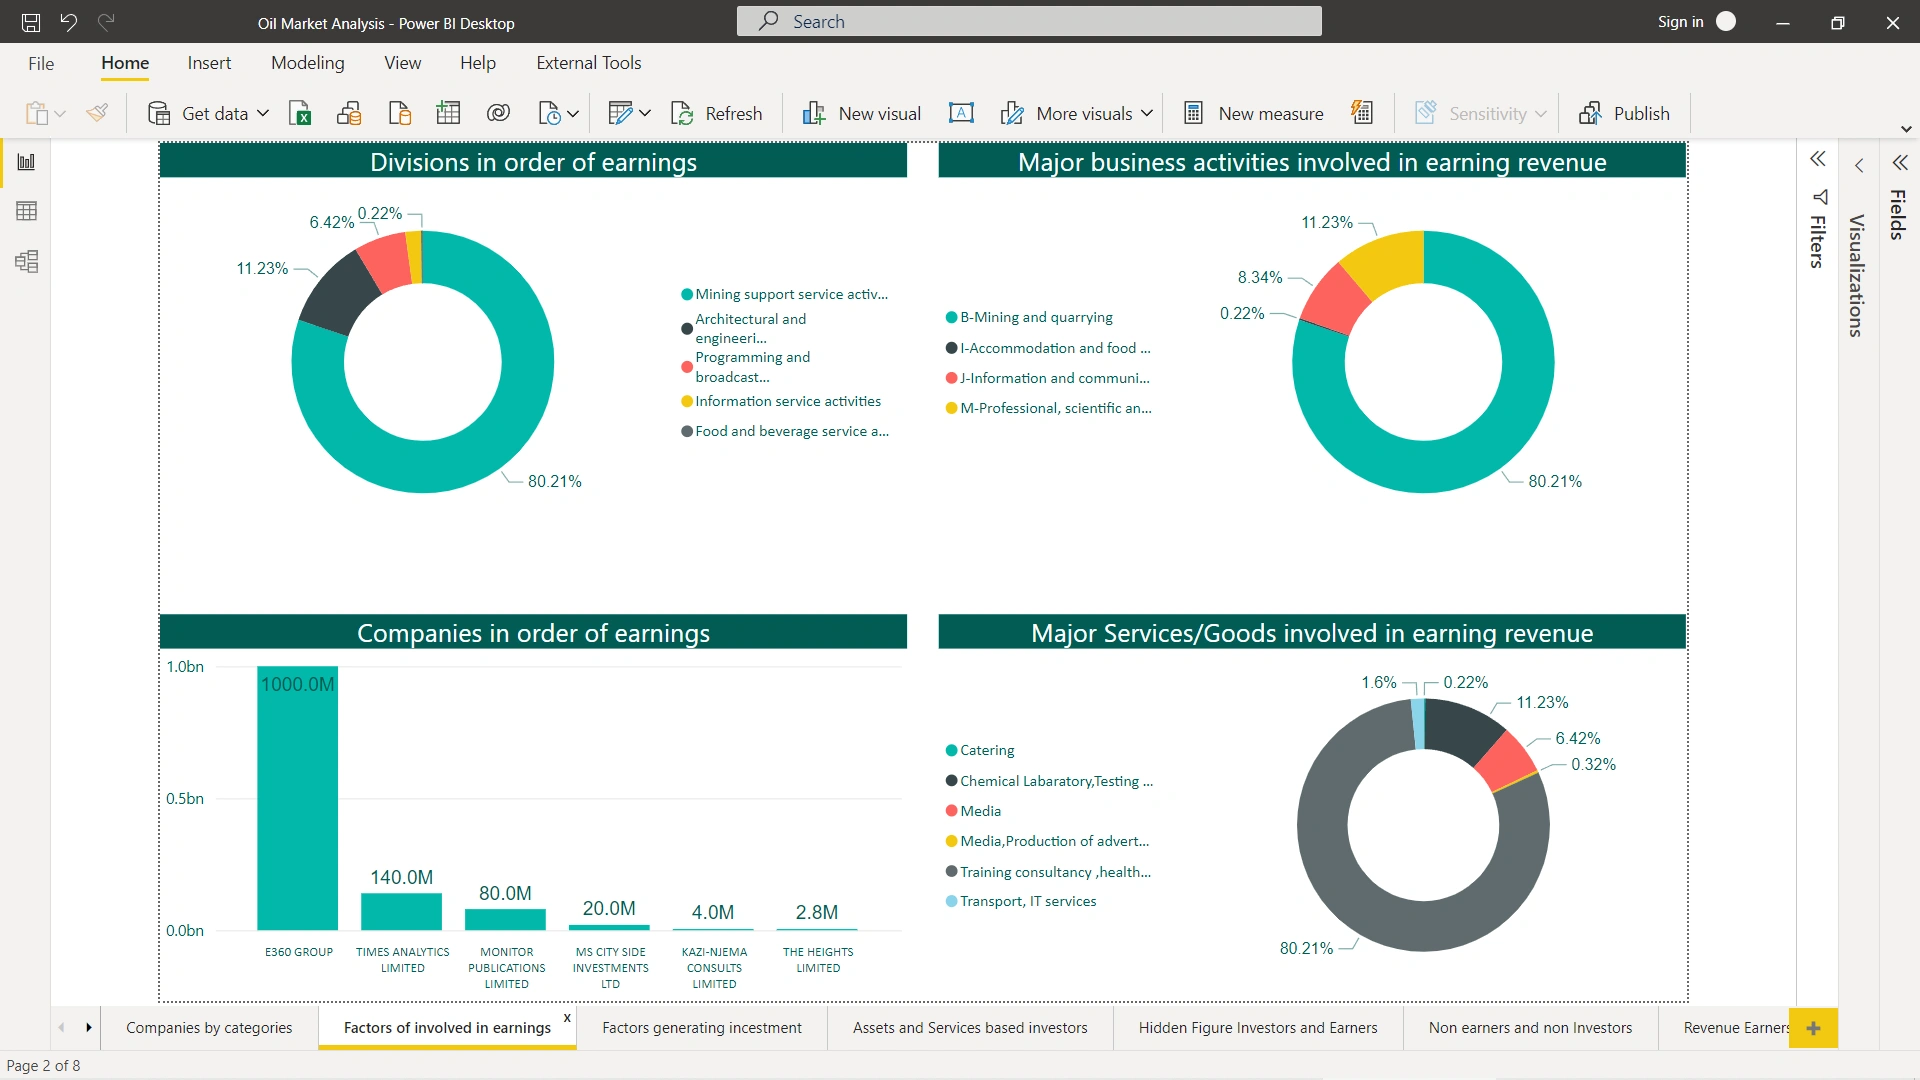
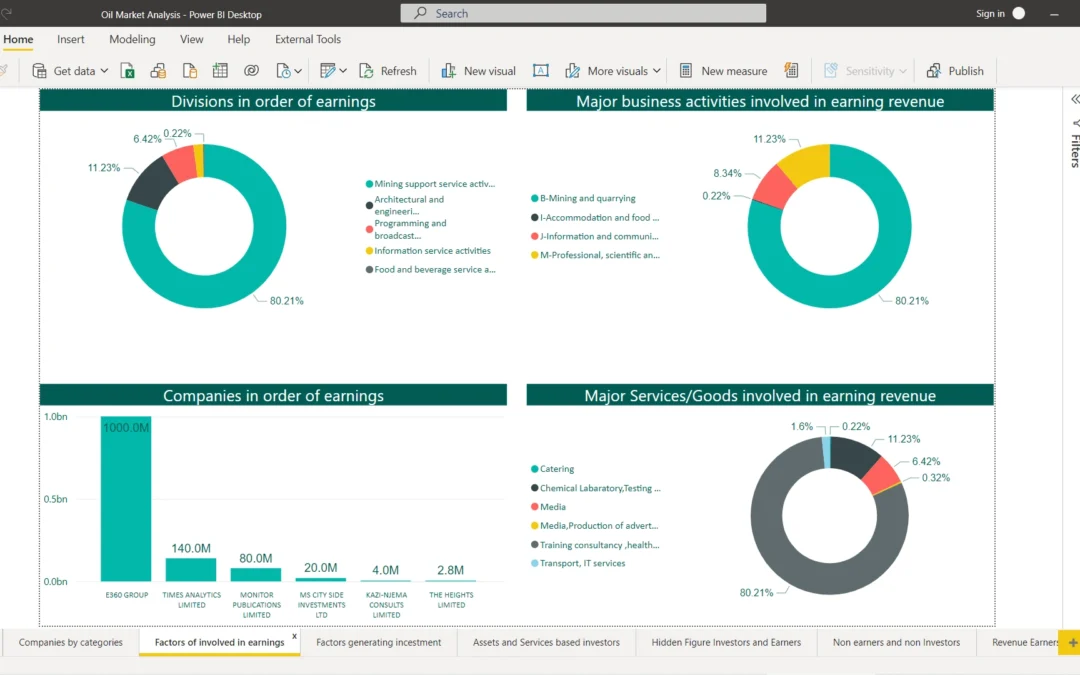
A Power BI dashboard that brings oil market data into one clear view for comparison over time and region.
Data & Business Intelligence
Oil market analysis engagement
Energy · Market intelligence
Data & Business Intelligence
Power BI · Excel · Tableau
Market data sat in separate tables and was hard to compare over time or region, in an Excel file.
One modelled dataset combining the source tables into a reliable structure for analysis.
Interactive filters for period, region and product so stakeholders can cut the data their way.
KPI cards for the measures that matter most at a glance.
Trend views that make performance over time easier to read than spreadsheet rows.
More than 10 sources in one view — so comparisons no longer depend on manual spreadsheet work.
Data sources unified in one dashboard
Dashboard overview with KPI cards and trend views
Interactive filters for period, region and product